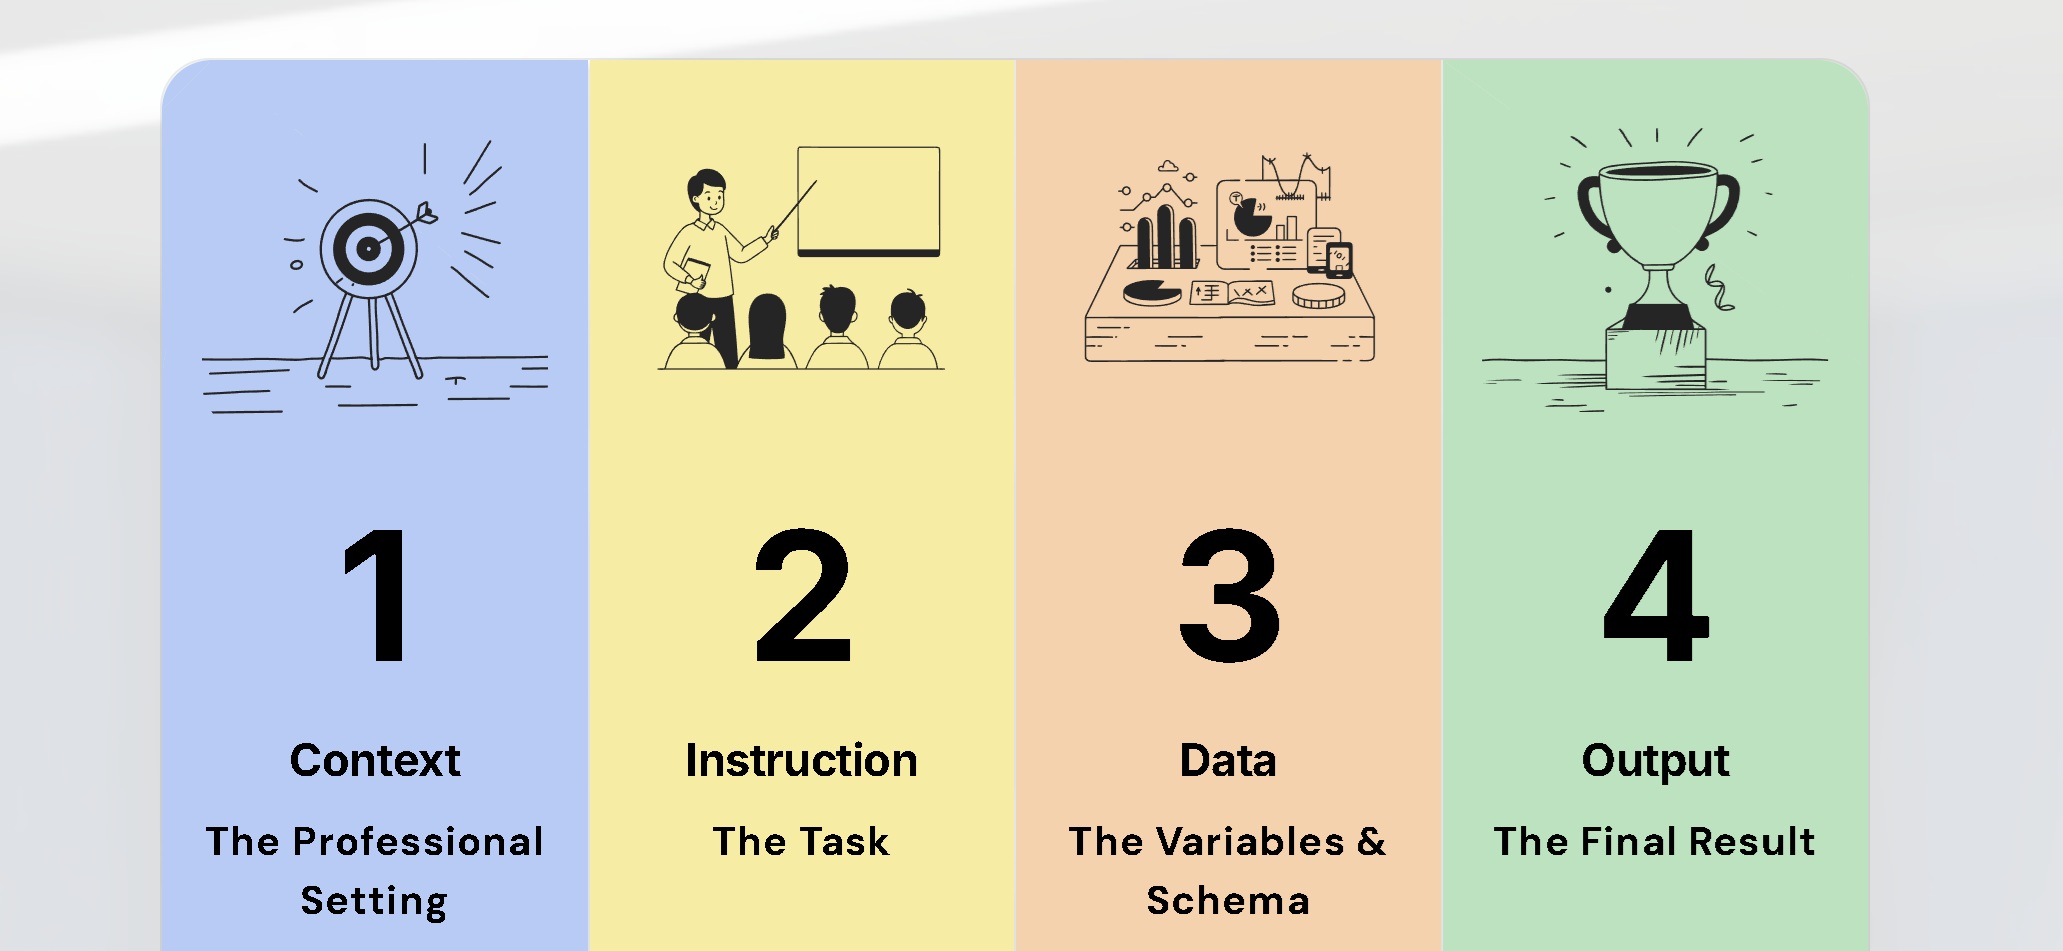
The Four Pillars of CIDO
CIDO in Practice: Data Analysis Examples
Now let's examine two examples of prompts with the CIDO Framework applied.
Scenario 1: Automating Python Cleaning Script

Prompt:
- Context: You are a Data Engineer focusing on data quality.
- Instruction: Create a Python script using Pandas to identify and handle outliers in a dataset.
- Data: A dataset (sales_data.csv) containing unit_price, quantity, and transaction_timestamp.
- Output/Outcome: A clean, commented script that uses the Interquartile Range (IQR) method and exports a report of how many rows were modified.
Result:
import pandas as pd
# —————————–
# Configuration
# —————————–
INPUT_FILE = "sales_data.csv"
OUTPUT_FILE = "sales_data_clean.csv"
REPORT_FILE = "outlier_report.csv"
NUMERIC_COLUMNS = ["unit_price", "quantity"]
# —————————–
# Load data
# —————————–
df = pd.read_csv(INPUT_FILE)
# Ensure timestamp is properly typed (good data hygiene)
df["transaction_timestamp"] = pd.to_datetime(
df["transaction_timestamp"], errors="coerce"
)
# Keep a copy to compare changes later
df_original = df.copy()
# —————————–
# IQR-based outlier handling
# —————————–
outlier_report = []
for col in NUMERIC_COLUMNS:
# Calculate IQR bounds
q1 = df[col].quantile(0.25)
q3 = df[col].quantile(0.75)
iqr = q3 – q1
lower_bound = q1 – 1.5 * iqr
upper_bound = q3 + 1.5 * iqr
# Identify outliers
outlier_mask = (df[col] < lower_bound) | (df[col] > upper_bound)
outlier_count = outlier_mask.sum()
# Cap values to the IQR bounds (winsorization)
df.loc[df[col] < lower_bound, col] = lower_bound
df.loc[df[col] > upper_bound, col] = upper_bound
outlier_report.append({
"column": col,
"lower_bound": lower_bound,
"upper_bound": upper_bound,
"rows_modified": int(outlier_count)
})
# —————————–
# Build summary report
# —————————–
report_df = pd.DataFrame(outlier_report)
report_df["total_rows"] = len(df)
# Optional: total rows affected across all columns
total_rows_modified = (
df[NUMERIC_COLUMNS] != df_original[NUMERIC_COLUMNS]
).any(axis=1).sum()
summary_row = {
"column": "ALL",
"lower_bound": None,
"upper_bound": None,
"rows_modified": int(total_rows_modified),
"total_rows": len(df)
}
report_df = pd.concat(
[report_df, pd.DataFrame([summary_row])],
ignore_index=True
)
# —————————–
# Export outputs
# —————————–
df.to_csv(OUTPUT_FILE, index=False)
report_df.to_csv(REPORT_FILE, index=False)
print("Outlier handling completed.")
print(f"Clean data saved to: {OUTPUT_FILE}")
print(f"Outlier report saved to: {REPORT_FILE}")
Scenario 2: Explaining Insights to Stakeholders

Prompt:
- Context: You are a Data Storyteller presenting to the Marketing team.
- Instruction: Translate technical statistical significance into "plain English" business value.
- Data: An A/B test result showing a p-value of 0.03 and a 5% lift in Click-Through Rate (CTR).
- Output/Outcome: A 3-bullet summary that explains whether the test was successful and if the team should "roll out" the feature.
Result:
Here’s the plain-English, marketing-friendly version—no stats degree required:
- The test worked: The new version increased Click-Through Rate by 5%, and the p-value of 0.03 means this result is very unlikely to be due to random chance. In other words, it’s a real improvement, not a fluke.
- What this means for the business: A 5% lift in CTR translates directly into more people engaging with our campaigns—which typically leads to more leads, more conversions, and better ROI from the same marketing spend.
- Recommendation: ✅ Roll it out. The improvement is statistically reliable and delivers clear upside with low risk, making it a smart move to launch this version to all users.
If you want, I can also add a one-liner for exec slides or a “what could go wrong” risk note for stakeholders.
Why Use CIDO?
To radically reduce effort and increase strategic impact, an AI Enabled Data Specialist can leverage CIDO Framework across the entire analytics lifecycle in activities like:
Data Ingestion & Integration
Get data connected fast, correctly, and at scale
AI-assisted key activities
- Auto-discovery of data sources (databases, APIs, SaaS, files, streams)
- Schema inference & automatic data type detection
- Intelligent connector generation (SQL, REST, GraphQL)
- AI-generated ingestion pipelines (batch & streaming)
- Automatic join/key suggestions across heterogeneous sources
- Data freshness & anomaly alerts on ingestion
Value to the business
- Days → minutes to onboard new data
- Lower dependency on data engineering teams
- Faster time-to-insight


Data Cleansing & Quality Management
Make data usable, trustworthy, and consistent
AI-assisted key activities
- Automated detection of:
- Missing values
- Outliers
- Duplicates
- Inconsistent formats
- Smart imputation strategies (context-aware, not averages)
- Pattern recognition for standardization (names, addresses, IDs)
- Rule generation for data validation
- Root-cause analysis of data quality issues
- Auto-generated data quality reports
Value to the business
- Higher confidence in numbers
- Reduced rework and firefighting
- Consistent KPIs across teams

Data Understanding & Exploratory Analysis
Understand what the data is saying without weeks of manual analysis
AI-assisted key activities
- Natural-language data exploration (“Why did churn spike in Q4?”)
- Automated statistical summaries & distributions
- Correlation and dependency discovery
- Trend and seasonality detection
- Hypothesis generation (“Possible drivers of revenue decline”)
- Automatic insight prioritization by business impact
Value to the business
- Analysts focus on thinking, not querying
- Faster decision cycles
- More insights surfaced, not just the obvious ones
Feature Engineering & Transformation

Turn raw data into decision-ready assets
AI-assisted key activities
- Auto-generation of derived features
- Time-window aggregation suggestions
- Encoding strategies for categorical variables
- Feature importance ranking
- Reusable transformation logic generation (SQL / Python / dbt)
- Documentation of transformations (human-readable)
Value to the business
- Better models and sharper KPIs
- Reproducible analytics logic
- Easier handover and governance

Clustering, Segmentation & Advanced Analytics
Discover structure and patterns humans miss
AI-assisted key activities
- Automatic selection of clustering algorithms
- Optimal cluster number detection
- Behavioral, demographic, and value-based segmentation
- Segment profiling & labeling (human-friendly descriptions)
- Drift detection in segments over time
- Scenario testing (“What happens if we target Segment B?”)
Value to the business
- Actionable segments, not academic clusters
- Better targeting, personalization, and prioritization
- Clear narratives around customer behavior
KPI Definition, Monitoring & Forecasting
Measure what truly matters and anticipate outcomes
AI-assisted key activities
- KPI suggestion aligned to business objectives
- Metric definitions auto-generated & documented
- Anomaly detection on KPIs
- Root-cause analysis when KPIs move
- Forecasting with confidence intervals
- What-if simulations
Value to the business
- Fewer vanity metrics
- Early warning systems for risk
- Data-driven planning instead of reactive reporting

Automated Reporting & Dashboard Generation

Deliver insights continuously, not manually
AI-assisted key activities
- Auto-generated dashboards from business questions
- Narrative summaries embedded in reports
- Audience-specific views (CEO, Sales, Ops)
- Dynamic commentary on changes vs last period
- Report scheduling & distribution
- Multilingual report generation
Value to the business
- Analysts stop “building slides”
- Executives get context, not raw charts
- Consistent storytelling across the organization
CEO-Level Presentations & Data Storytelling

Turn data into decisions
AI-assisted key activities
- Executive-ready slide generation
- Insight-first structure (problem → insight → action)
- Story arc creation (past → present → future)
- Visual recommendation (best chart for each insight)
- Risk & opportunity framing
- Actionable recommendations with quantified impact
Value to the business
- Clear strategic narratives
- Faster executive alignment
- Data teams seen as strategic partners, not report builders
Documentation, Governance & Knowledge Retention

Make analytics scalable and auditable
AI-assisted key activities
- Auto-documentation of pipelines, metrics, and logic
- Business glossary generation
- Data lineage explanations in plain language
- Compliance & privacy checks
- Knowledge base Q&A over analytics assets
Value to the business
- Reduced key-person dependency
- Better compliance and audit readiness
- Faster onboarding of new analysts
Take Your Career to the Next Level
Ready to master the art of AI-driven analysis? This framework is just the beginning.
If you want to transition from basic prompting to becoming a sophisticated, AI-enabled Data Specialist, join our training: Applied AI for Strategic Data-Driven Decisioning: Prompt Engineering for Data Analysts.
In this course, we dive deep into advanced CIDO applications, automated workflow design, and strategic decision-making powered by LLMs.
